Development of Short-Range Dispersion Models to
Estimate Air Toxics Risk
in Urban Environments
Principal Investigator: Dr. Akula Venkatram
Sponsor: California Air Resources Board

|
In 1999, the California Air Resources Board (CARB) initiated its Neighborhood Assessment Program (NAP) to develop tools to assess the cumulative impacts of air pollutant emissions on neighborhood and local scales. |
|
|
|
|
To estimate the impact of urban sources at source-receptor distances of meters, a tracer experiment was designed and conducted at a parking lot of the College of Engineering’s Center for Environmental Research and Technology (CE-CERT). |
|
Experimental Setup |
SF6 line source and sampling sites |
 |
|
|

|
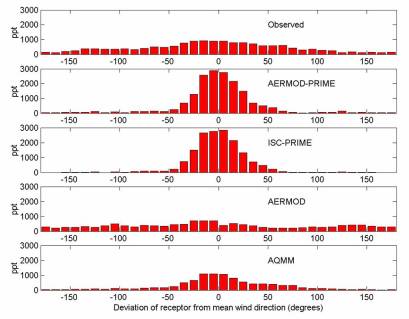
Variation of observed and estimated concentrations as a
function of deviation of wind direction from source-receptor
line |

|
The model evaluation clearly indicates the importance of including the randomizing effect of buildings on wind directions
|
|
Air
Quality Model with Meandering (AQMM)
predicts better |
|
|
|
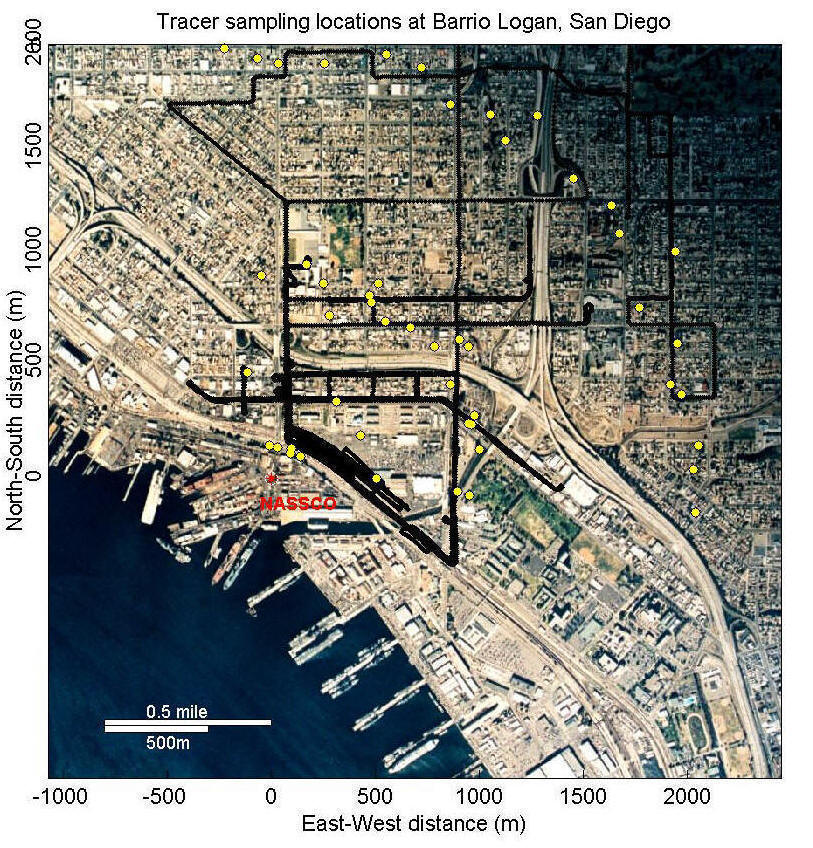
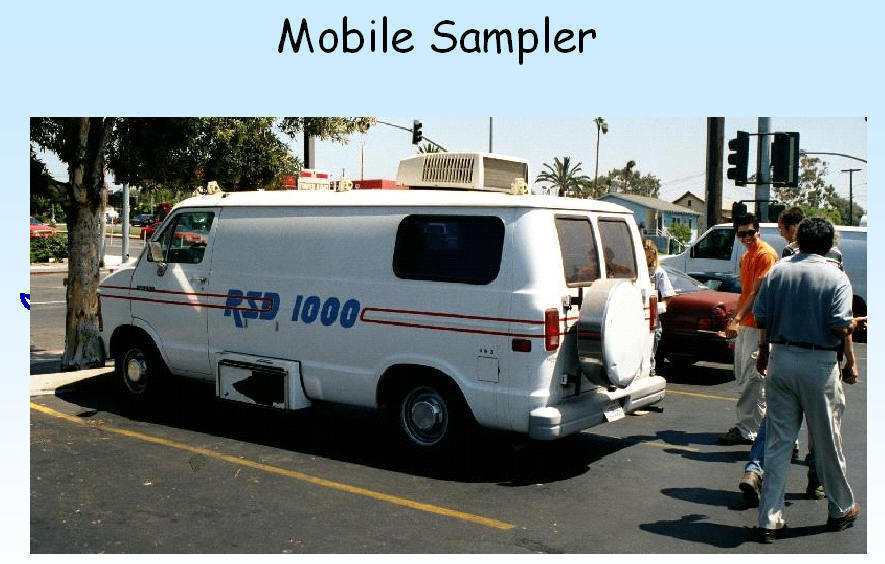
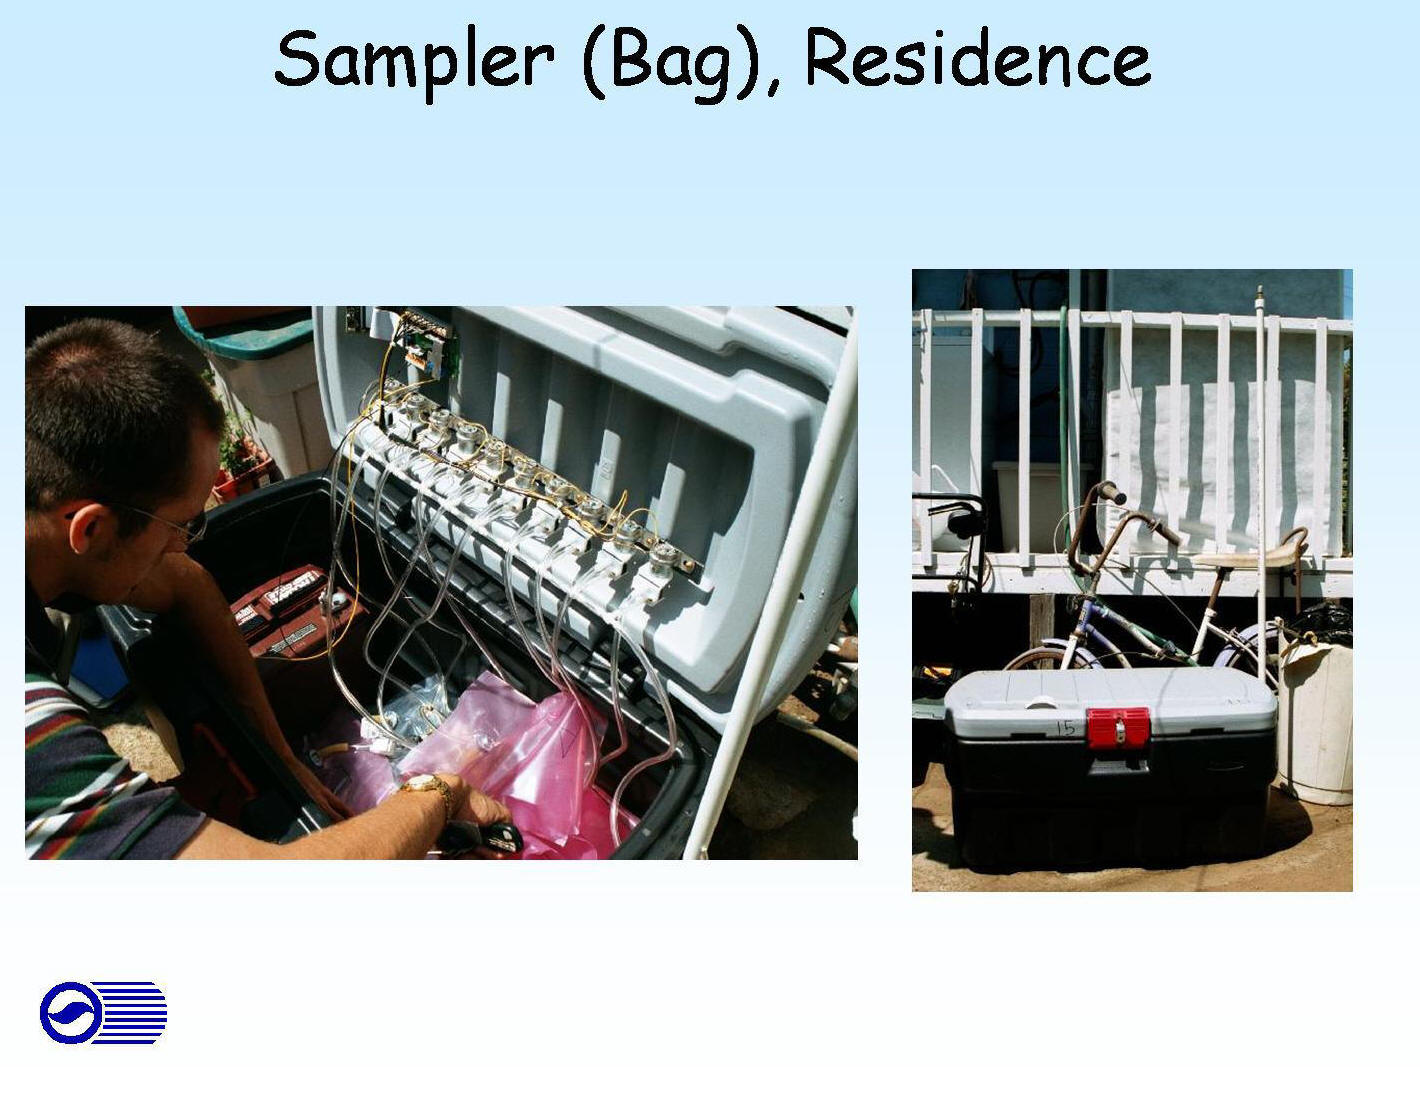
The model for source-receptor distances of the order of kilometers was evaluated with data derived from two tracer experiments conducted during August and December of 2001 at Barrio Logan, San Diego. |
|
|
 |
 |
|
Observed turbulent intensities vary by
less |
|
|
|
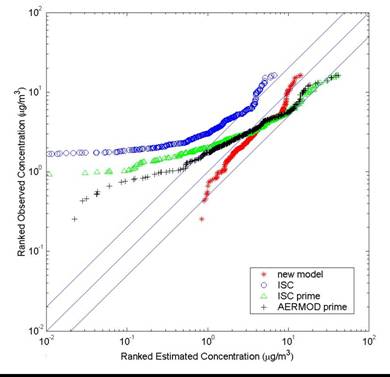
Model performance when initial |
|
|
|
Better model performance
when initial
It's necessary
to account for initial plume |

|
|

|
Related Publications |
Venkatram, A., Isakov, V., Pankratz, D., and Yuan, J., 2005: Relating plume spread to meteorology in urban areas. Atmospheric Environment, 39(2), 371-380
Venkatram, A., Isakov, V., Yuan, J., Pankratz, D., 2004: Modeling dispersion at distances of meters from urban sources. Atmospheric Environment, 38, 4633-4641
Venkatram, A., Isakov, V., Pankratz, D., Heumann, J., and Yuan, J., 2004: The analysis of data from an urban dispersion experiment. Atmospheric Environment, 38(22), 3647-3659